
Dashboard
The Dashboard is a section that can be composed of several information panels. Each of these reads the data from a specific table and displays them in the form of reports or graphs to allow the user to see the most important information at a glance.
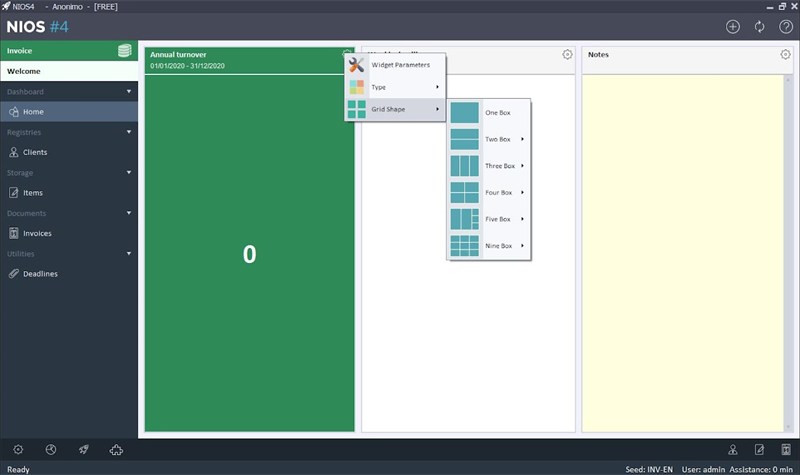
Each box has a button at the top and left: this allows you to manage the parameters of the box, choose the shape of the grid and set the type of box.
These settings are currently only available for Windows Web and MAC OS version. All the other devices will however display the dashboard as it has been configured. The versions for the phone will show the boxes one below the other.
Each user can customize the dashboard as he wants.
Apply to users
Allows you to apply your dashboard to selected users. This way everyone will have the dashboard set identical
None
Set the picture as empty.
Notes
Create a box where you can insert notes. They will be saved and synced. If the dashboard shape or widget type is changed, the notes will be lost.
Text
Allows you to link a text file to the pane to edit it. The file will be saved automatically. This widget can only be used in the windows version and locally
Allows you to set a line type chart
Allows you to set a pie type chart
Allows you to set a histogram chart
Create an indicator with a value read from the data and a value to reach.
Displays a value calculated from the data.
Displays a descriptive table of filtered data
Reminder
Displays the active reminders.
Table
Displays a filtered data table
Allows you to create a programmable push-button